
Beneficios
Garantiza el éxito de tu negocio comprendiendo el valor real de tus activos
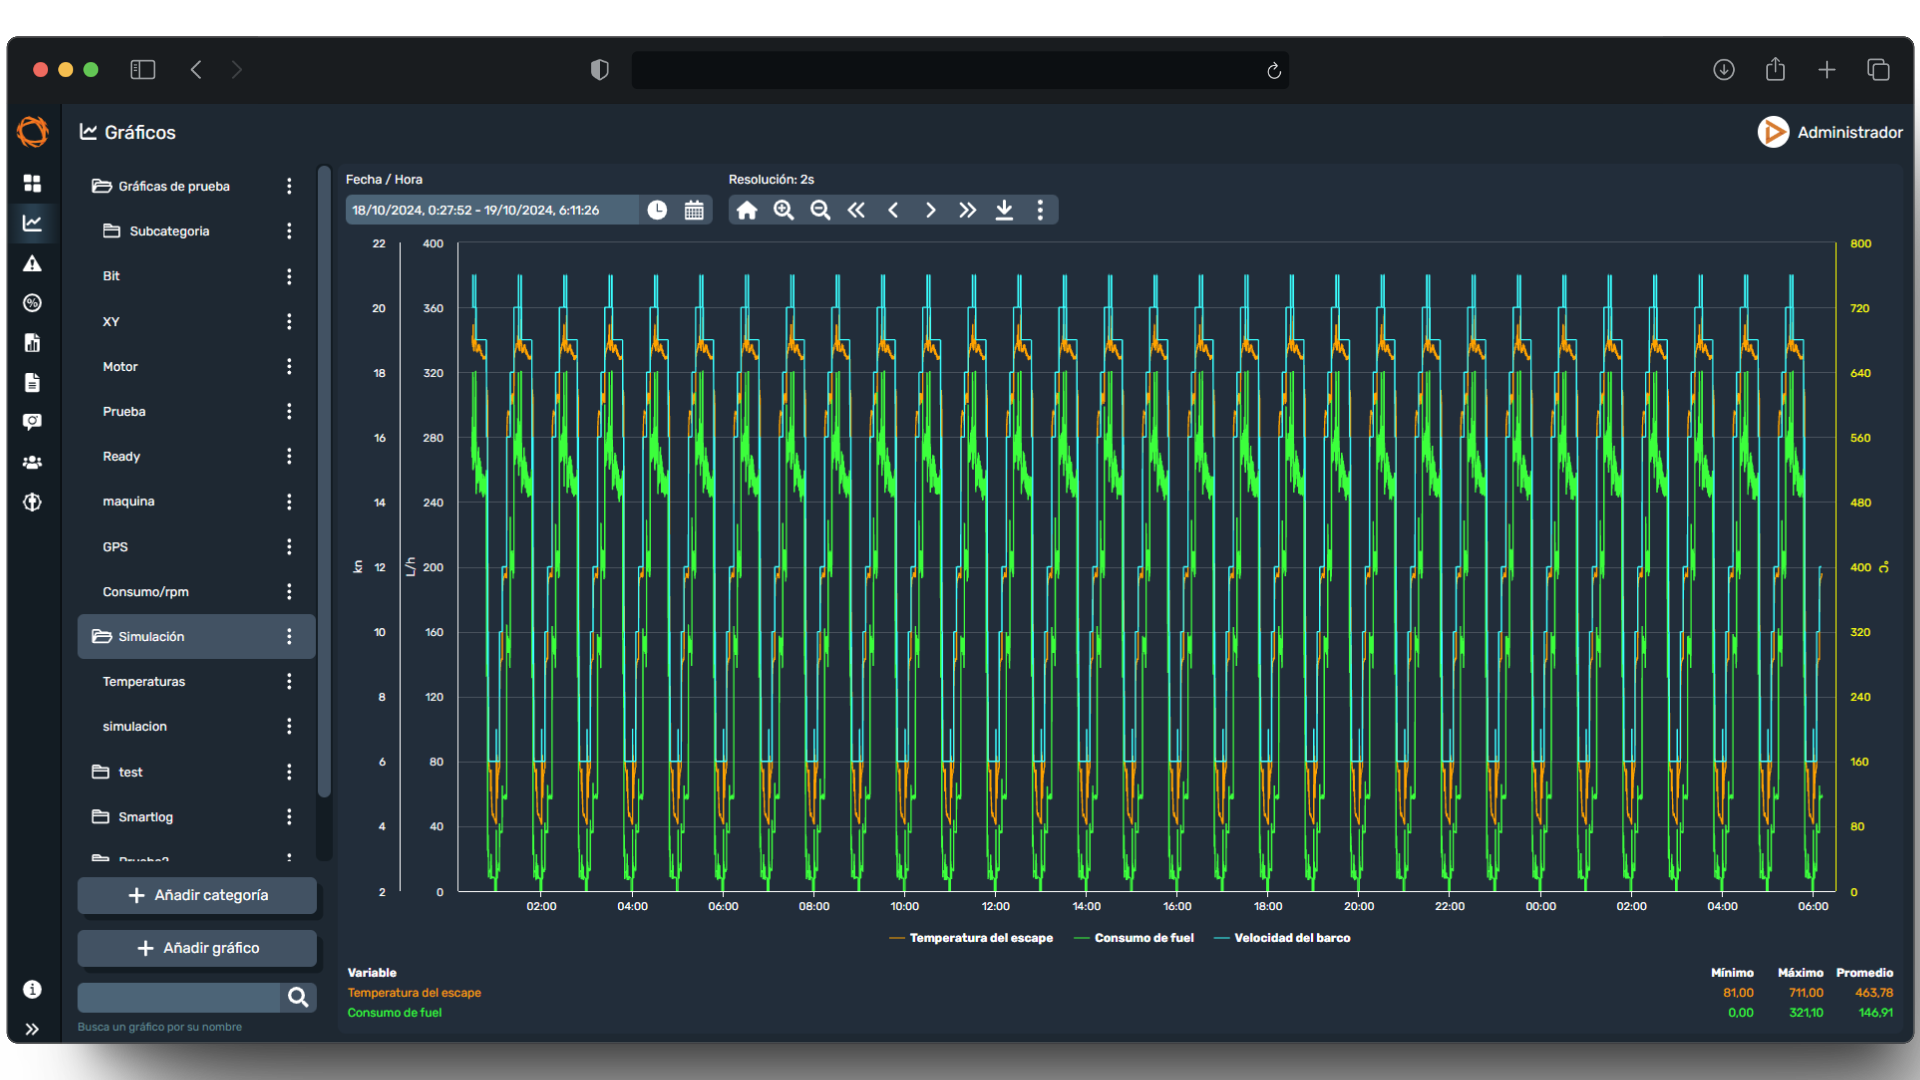
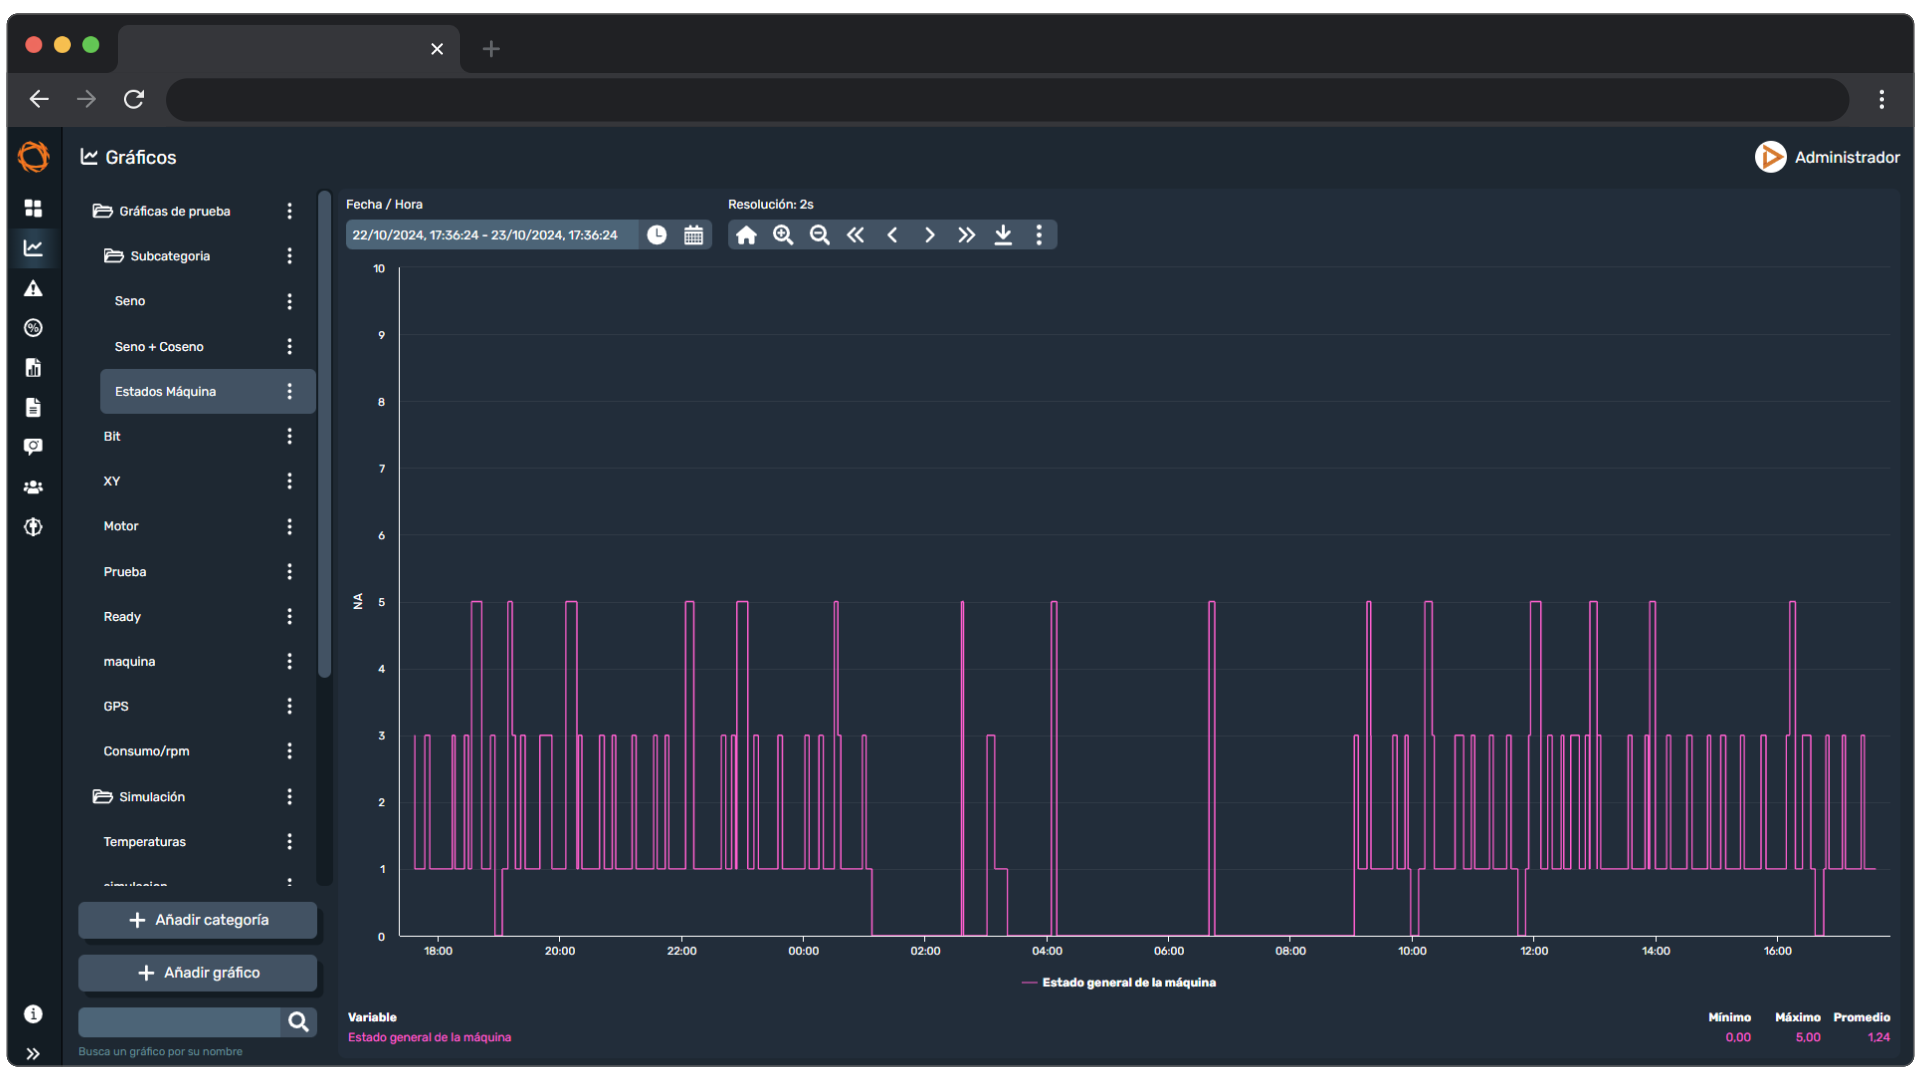
Detecta problemas con facilidad
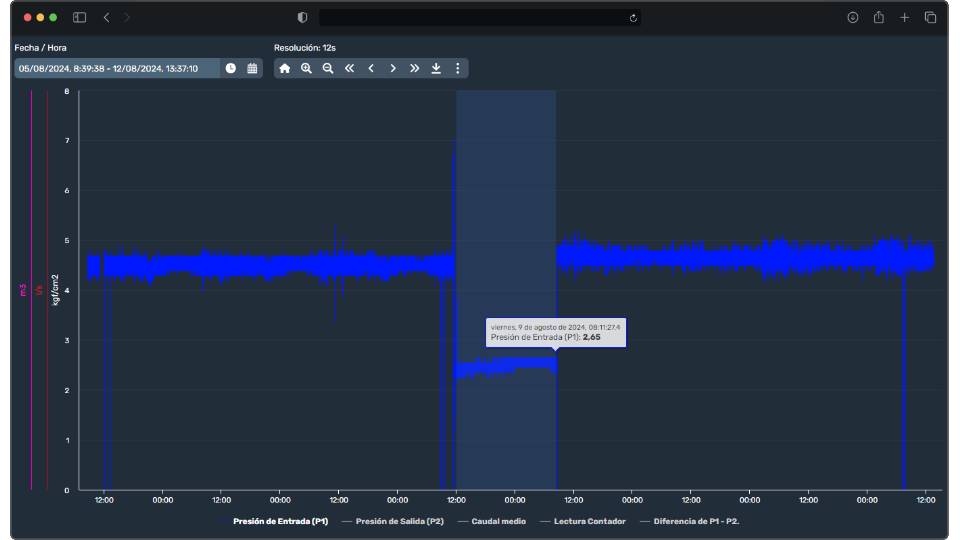
Dragsa te permite visualizar la evolución de tus activos a través de gráficas interactivas que revelan patrones de comportamiento, facilitando la identificación de anomalías y fallos.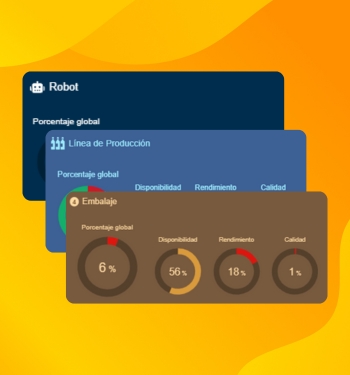
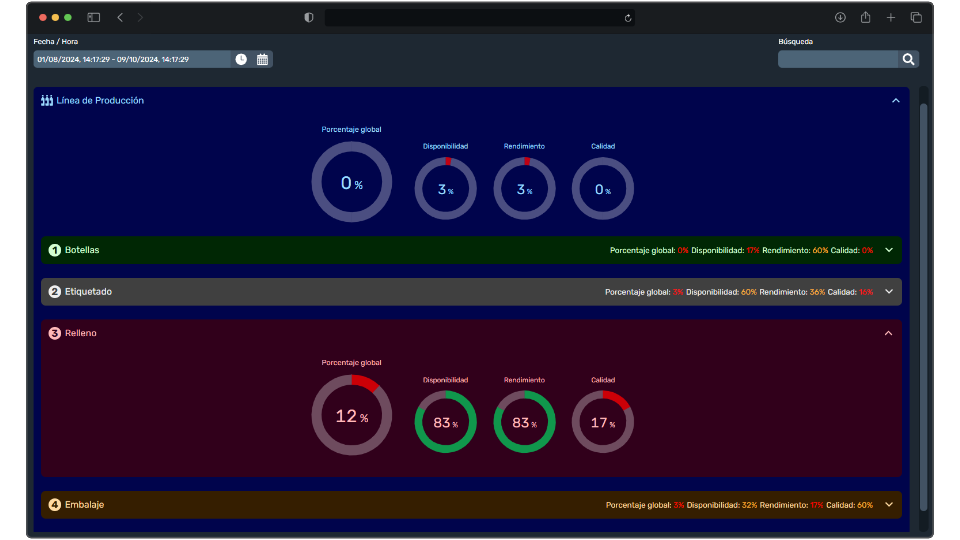
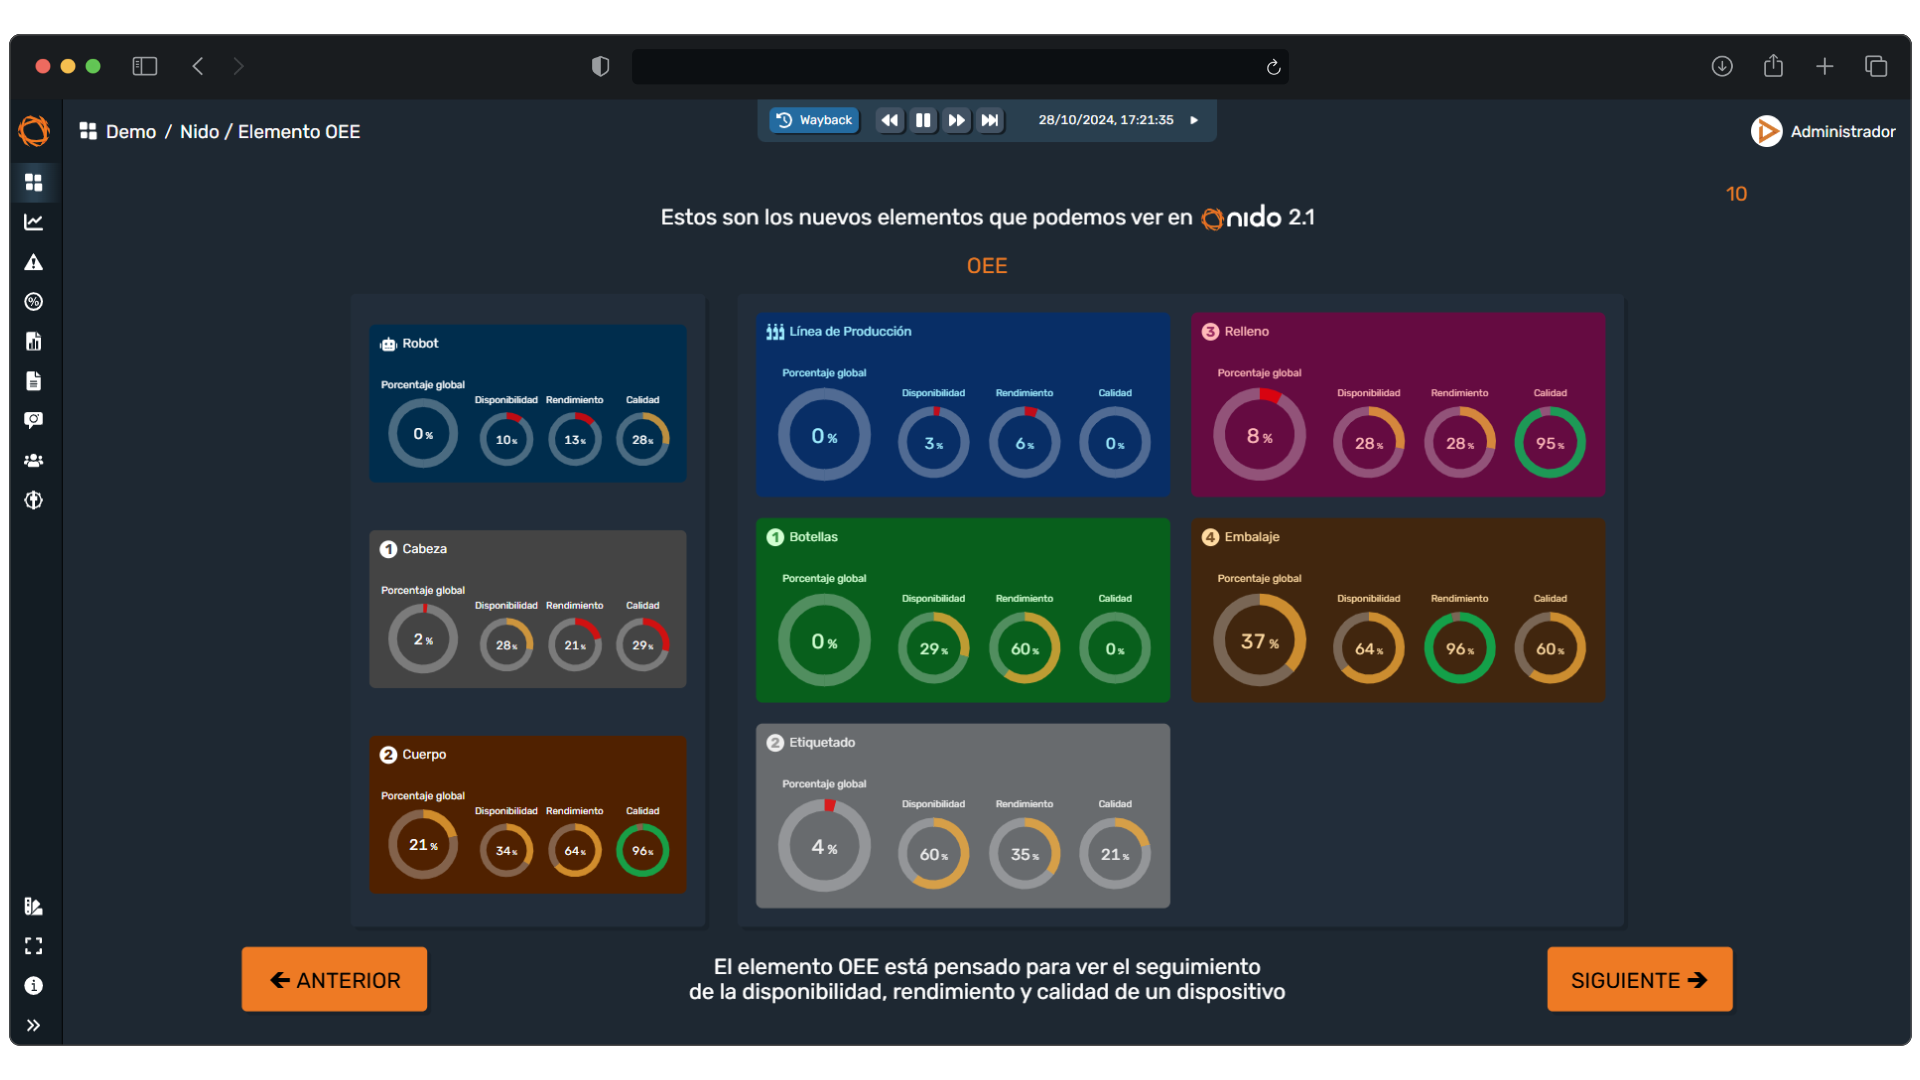
Cálculos de rendimiento y calidad
Dragsa transforma los datos en resultados con el nivel de rendimiento, disponibilidad, eficiencia y niveles de calidad de tus activos mediante cálculos precisos que permiten detectar oportunidades de mejora.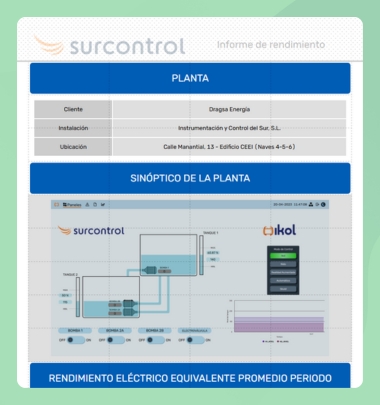
Informes personalizados y automáticos
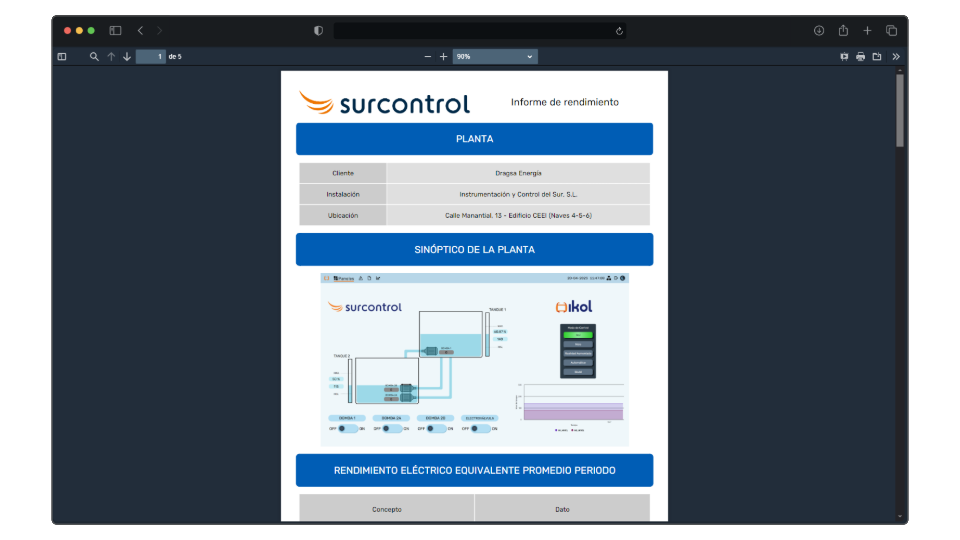
Crea reportes configurados a tu gusto con periodos flexibles que se generan automáticamente y se envían a tu correo electrónico quedando disponible en la plataforma para visualizar bajo demanda.
¿Cómo funciona?
Dragsa ayuda a descubrir que acciones tienen un mayor impacto en tu negocio
01.
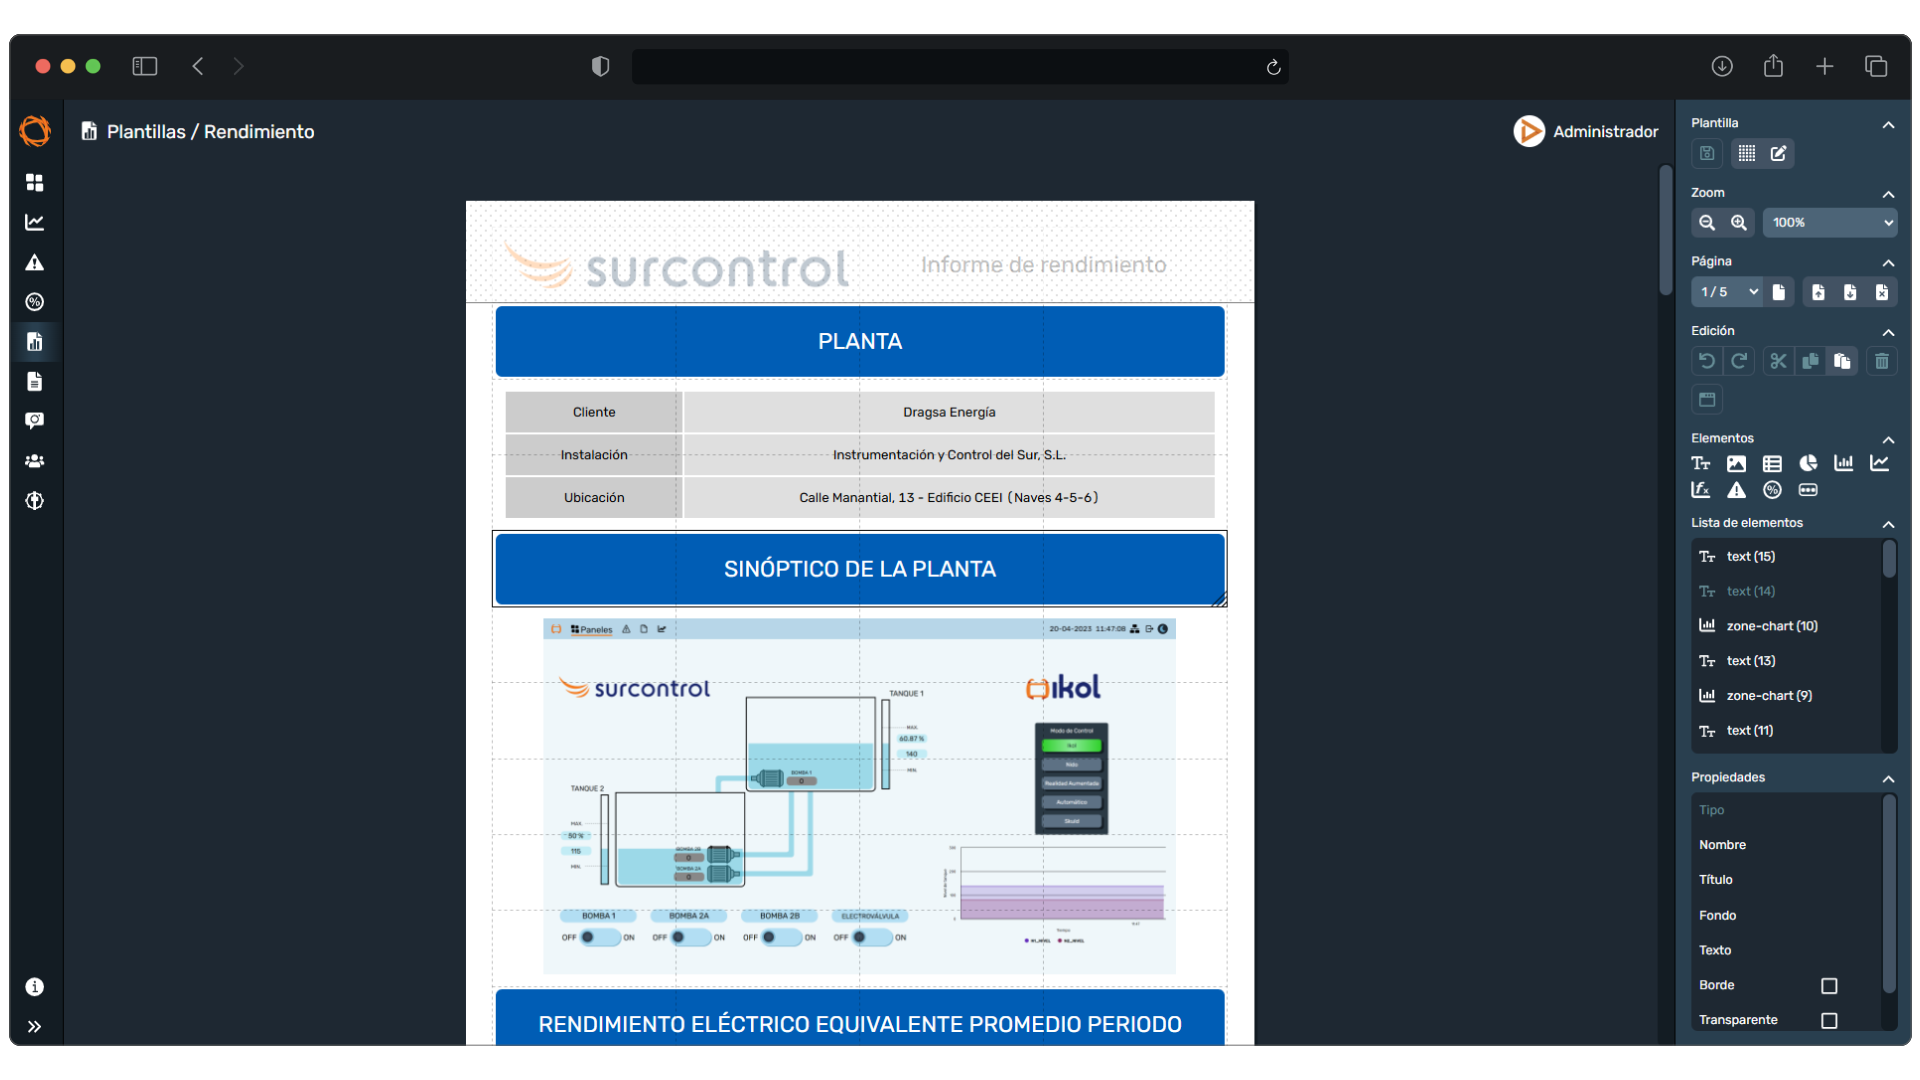
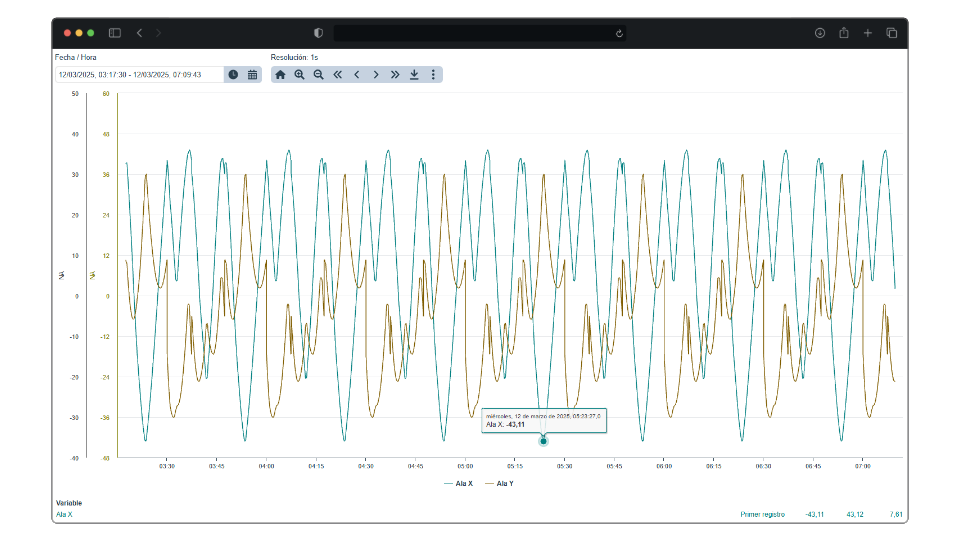
Diseña gráficas a medida
Personaliza y crea gráficas interactivas con facilidad. Dragsa Analytics recopila automáticamente los datos de tus activos conectados y los transforma en gráficas dinámicas y fáciles de interpretar.
02.
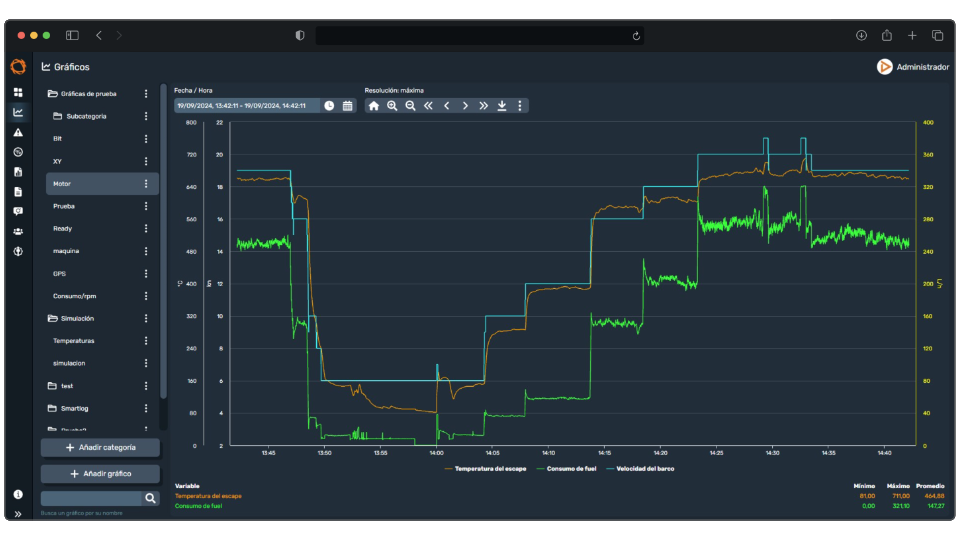
Analiza en tiempo real
Explora cada detalle de tus gráficos con un sistema de navegación fluido. Usa el cursor o el menú interactivo para desplazarte y realizar consultas en tiempo real.
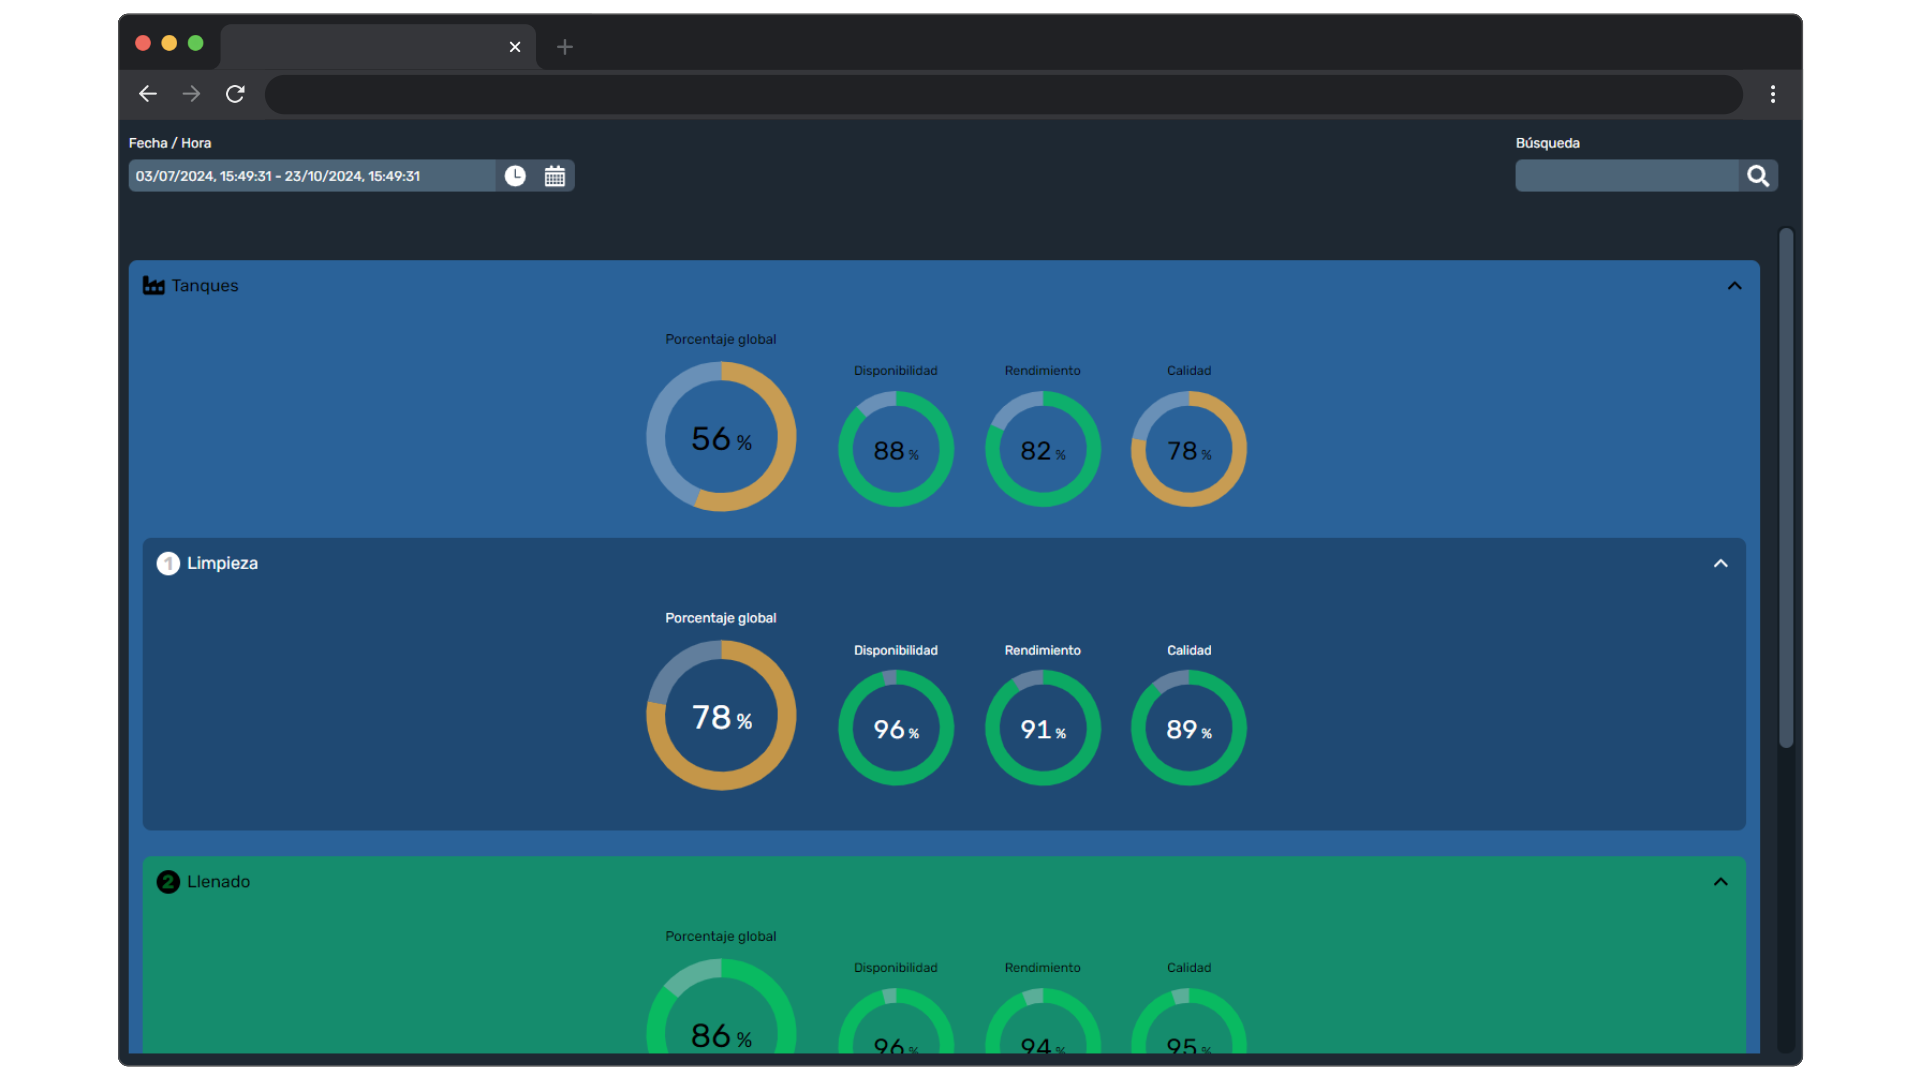
03.
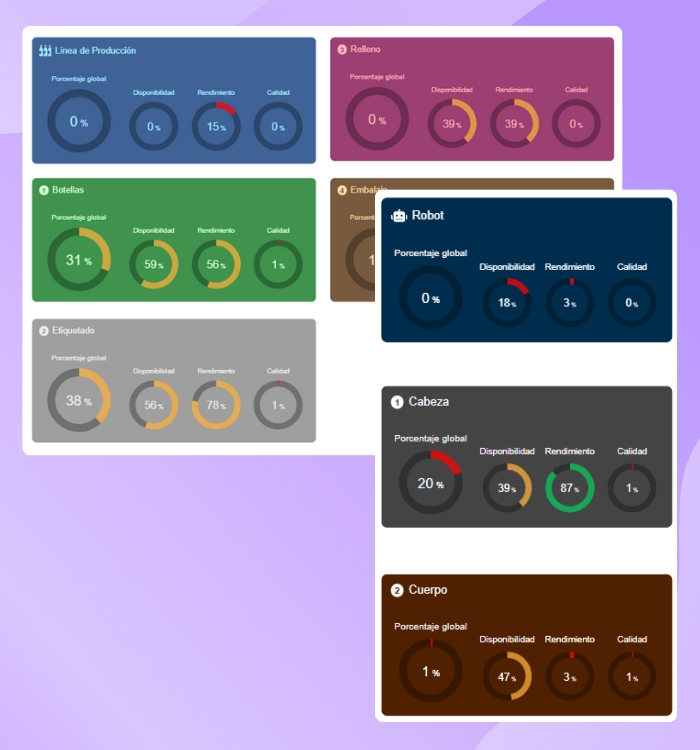
Descubre la productividad de tus activos
Dragsa Analytics se conecta directamente a tus activos industriales, procesa la información clave y genera análisis detallados sobre productividad, calidad y disponibilidad.
04.
Genera informes personalizados
Accede a un editor avanzado de informes donde puedes seleccionar qué activos, métricas y estados deseas representar. Diseña reportes detallados que se adapten a tus necesidades con total flexibilidad.
05.
Recibe tus informes bajo demanda
Configura y automatiza la generación de informes en los periodos que necesites: diarios, semanales, mensuales o personalizados. Recíbelos automáticamente por correo electrónico o accede a ellos directamente en la plataforma con un visor optimizado.
06.
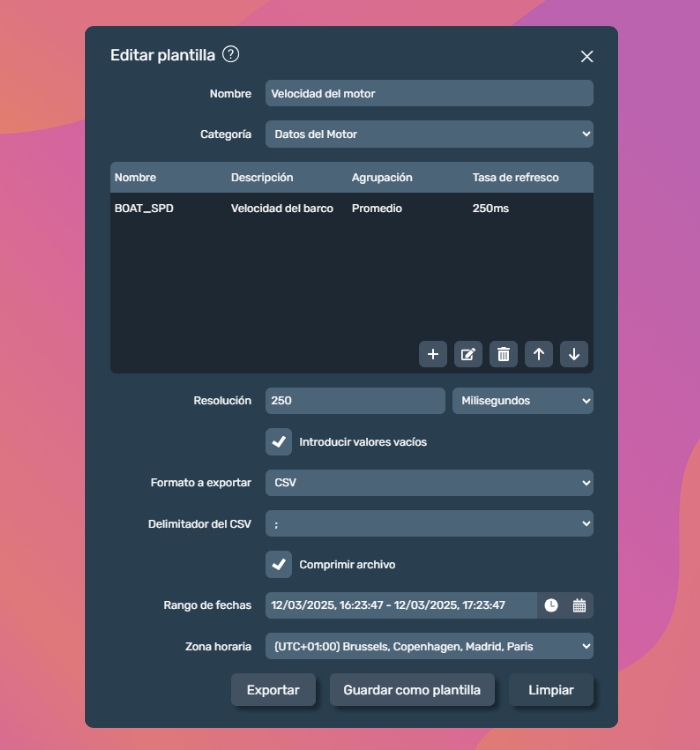
Tus datos siempre serán tuyos
Tus datos siempre estarán bajo tu control. Almacénalos en Dragsa y expórtalos en el formato que prefieras con un sistema de exportación flexible y parametrizable, adaptado a tus requerimientos.
07.
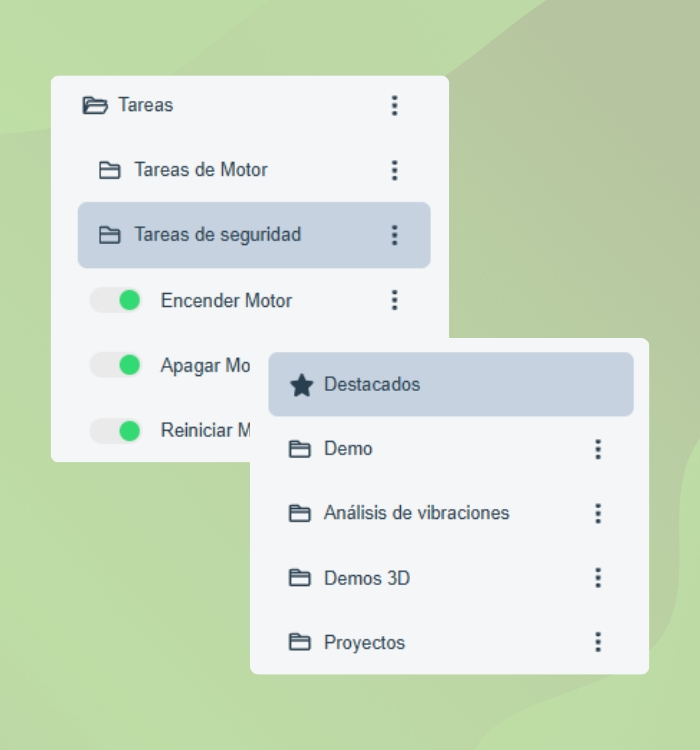
Organiza tu información
Organiza tus gráficas y tus informes en carpetas enumeradas e indexadas. Dragsa facilita la organización y la búsqueda de recursos dentro de la plataforma con funciones avanzadas de filtrado.
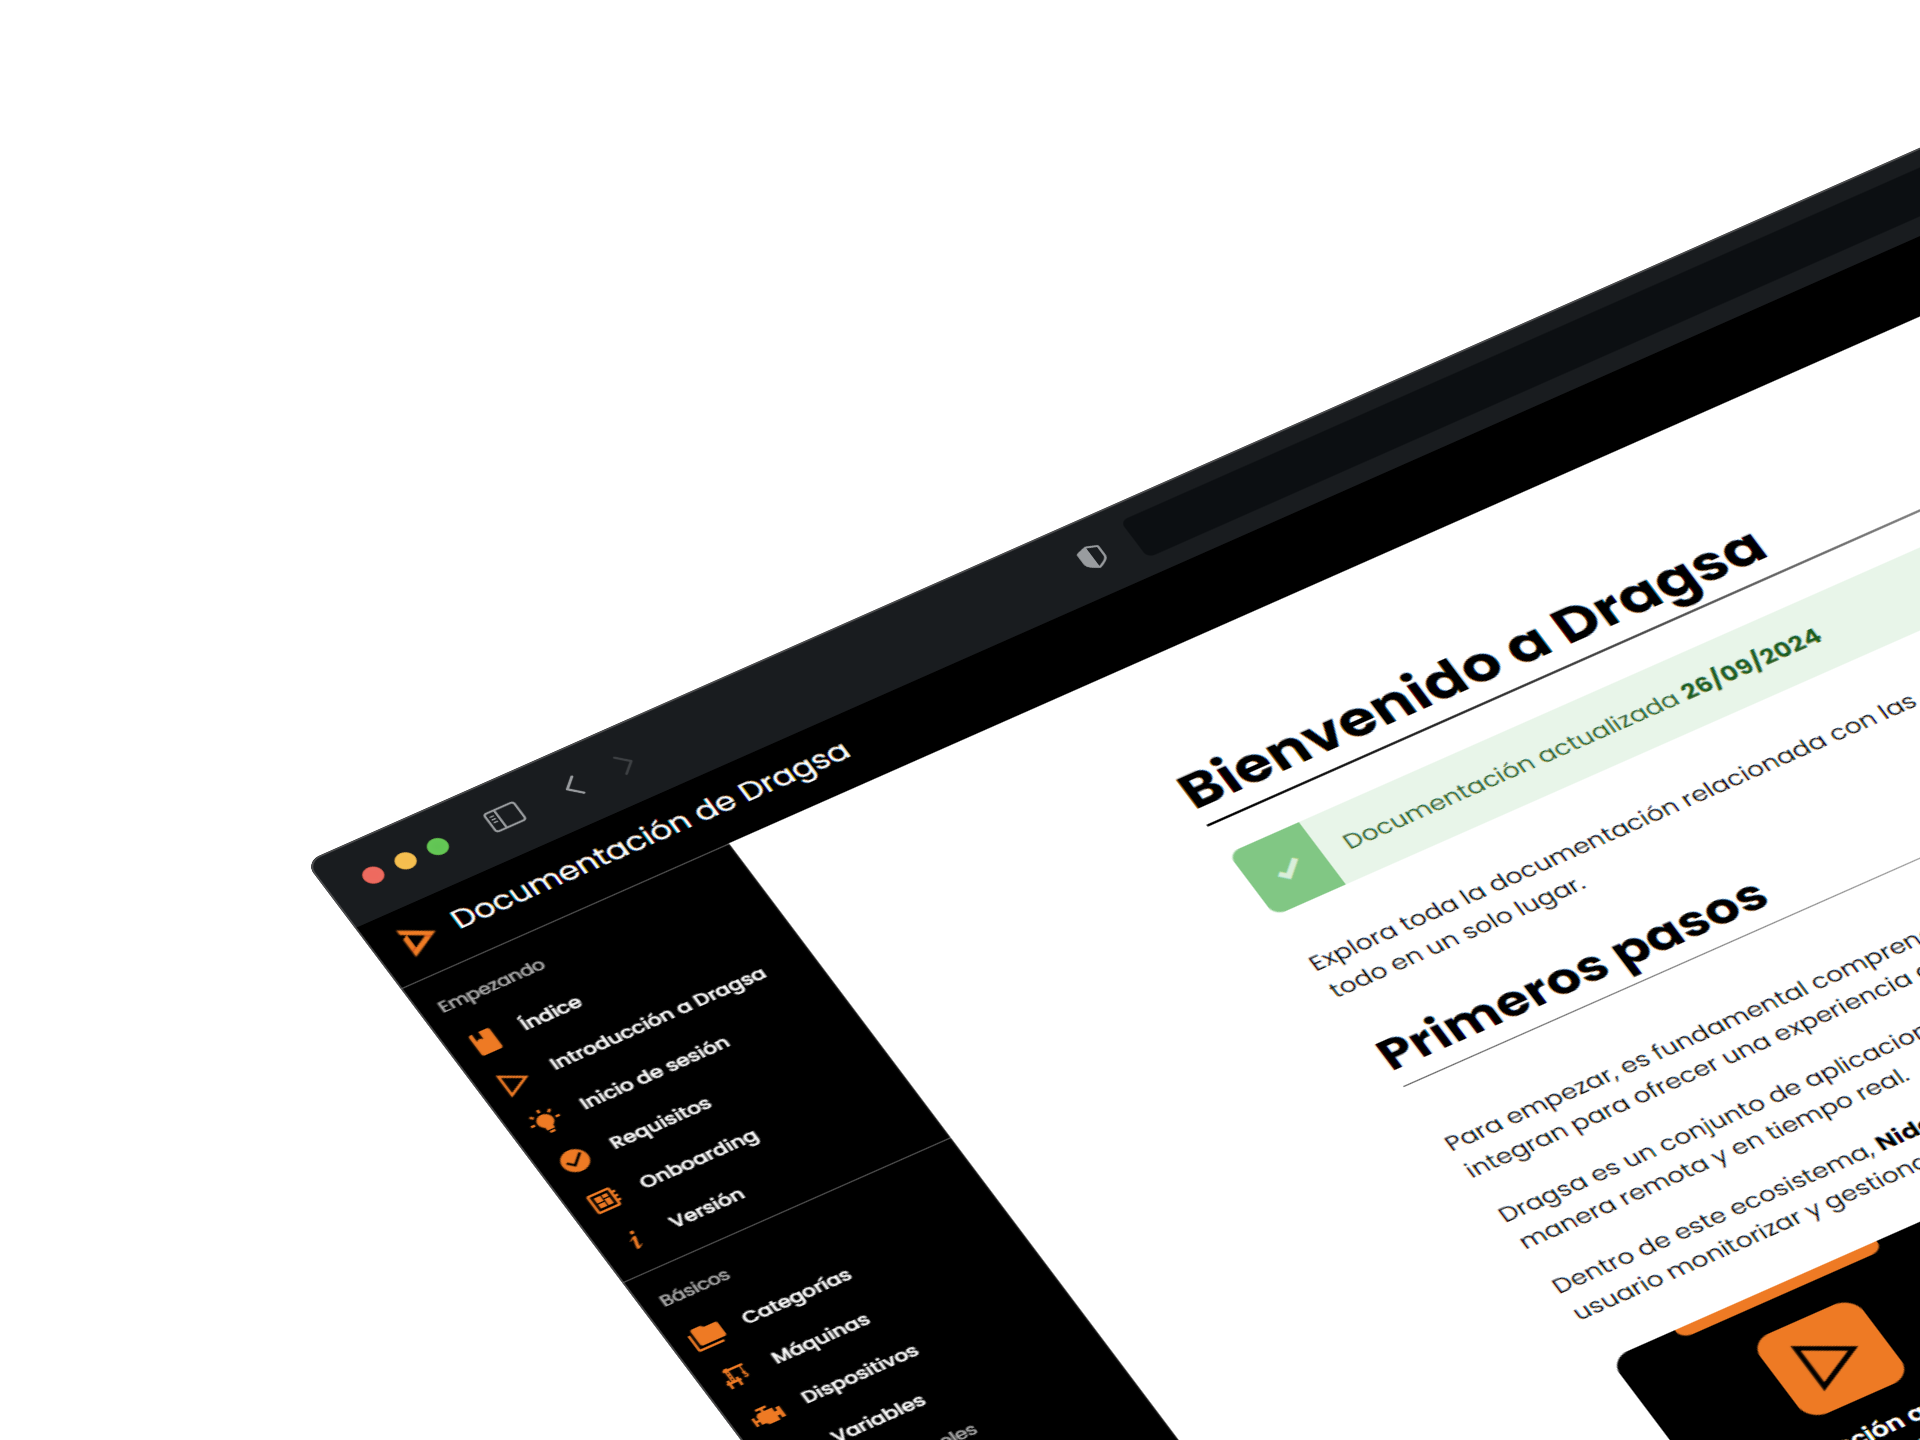
Documentación
No necesitas conocimientos técnicos
Dragsa proporciona un manual básico y avanzado para aprender a usar cada una de las funcionalidades que ofrece la plataforma
Información organizada
La documentación de Dragsa está estructurada de manera modular, organizándose en secciones que abarcan funcionalidades y elementos.
Se emplea un formato de Wiki, lo que permite enlazar la información de manera efectiva y facilitar la navegación.
Explicaciones al detalle
Dragsa proporciona descripciones exhaustivas de cada una de sus características, abarcando un nivel de detalle que va desde los elementos más pequeños de la plataforma hasta los servicios y funcionalidades más complejos.
Cada explicación incluye ejemplos prácticos, lo que facilita la comprensión y el uso efectivo de la plataforma.
Guías con vídeos
Cada sección y módulo de la documentación de Dragsa incluye un video autoguiado que proporciona una guía visual para los usuarios.
Estos videos explicativos demuestran cómo crear, editar, eliminar, personalizar e interactuar con cada uno de los elementos.
Mucho más que monitorización de activos