Facilita tus procesos con paneles interactivos personalizados
Dragsa permite a las empresas diseñar paneles y gráficos a medida para visualizar datos clave, adaptando colores, estilos y plantillas para cada caso de uso específico.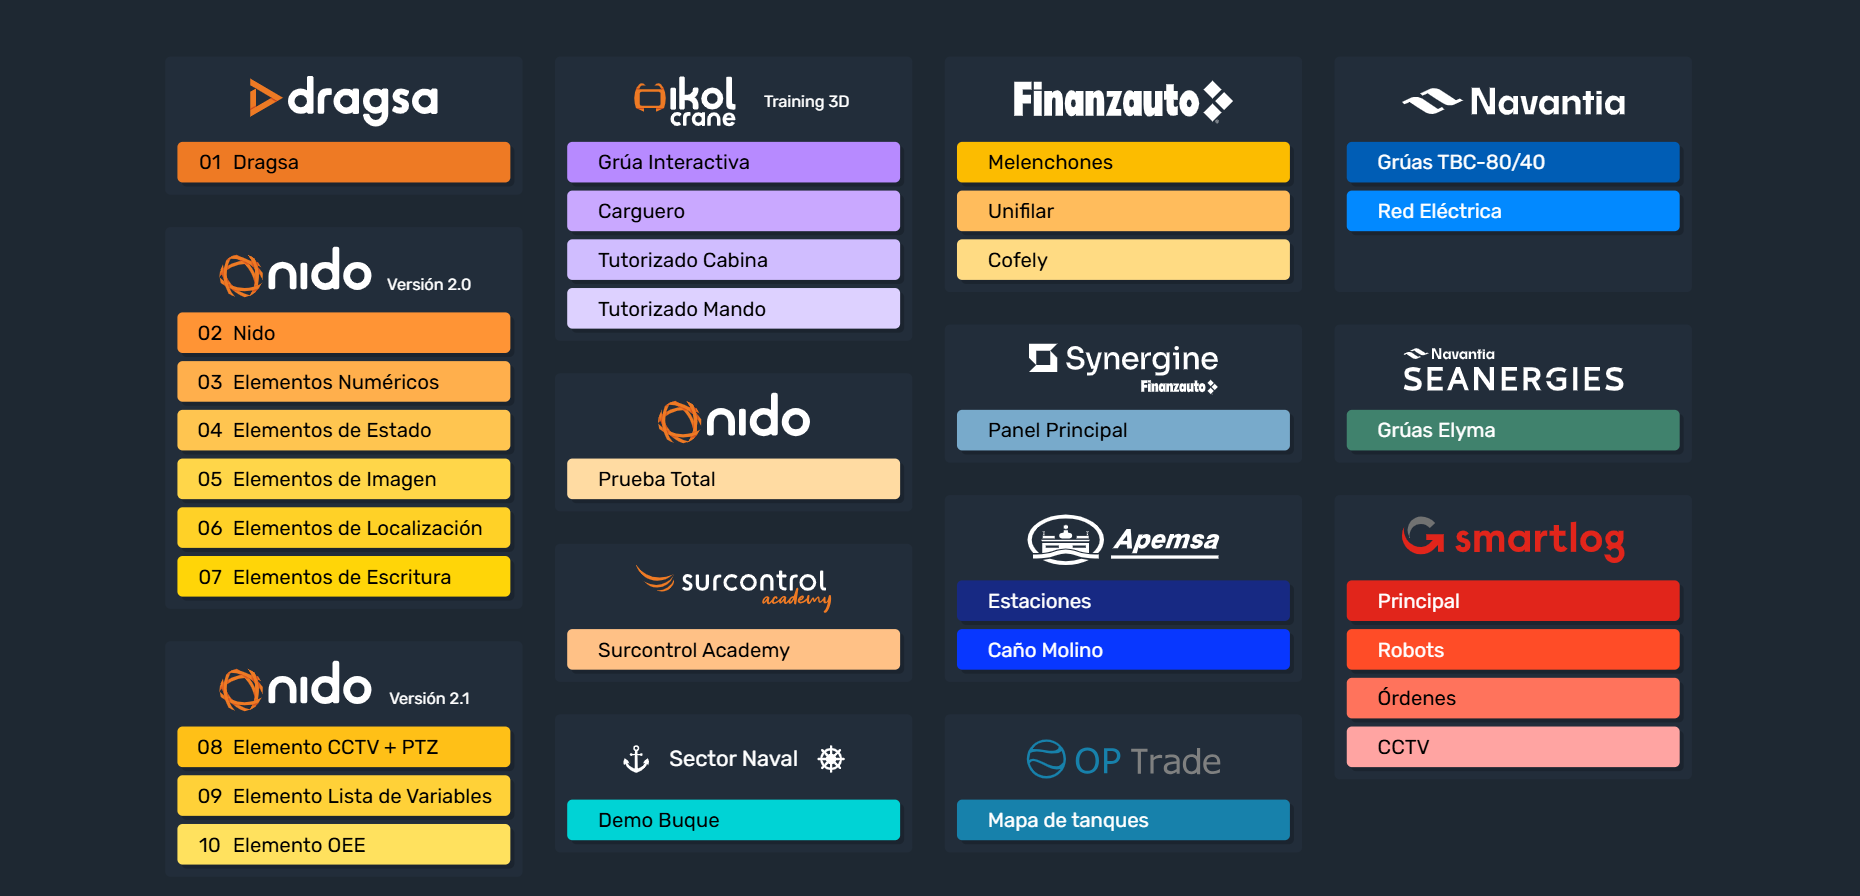
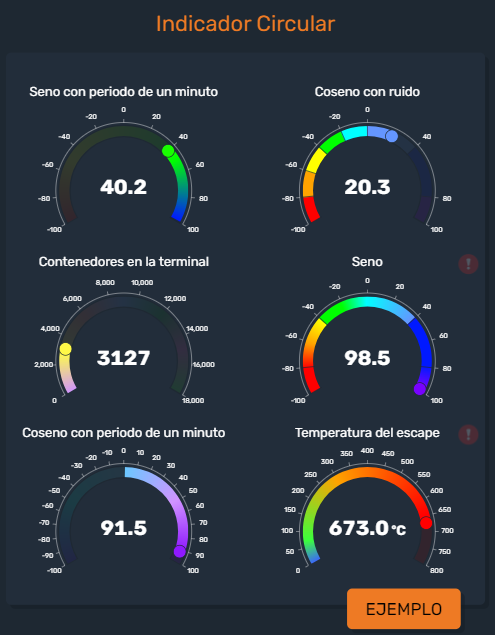
Interactividad y monitorización eficiente
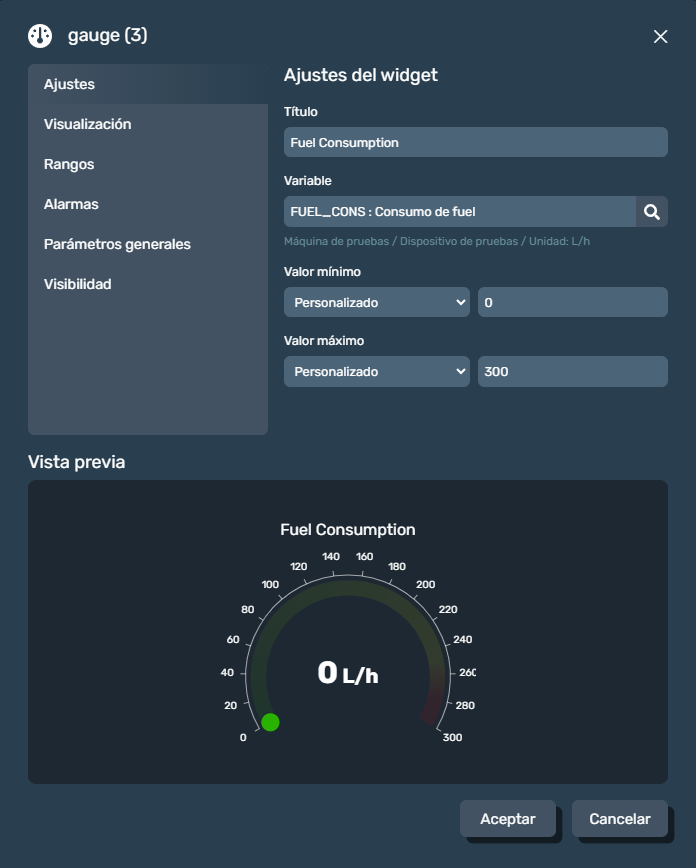
Dragsa facilita la creación de paneles visuales con elementos interactivos que brindan acceso en tiempo real a los datos, permitiendo a los usuarios ajustar y explorar la información clave de sus activos según sus necesidades.Personalización visual completa
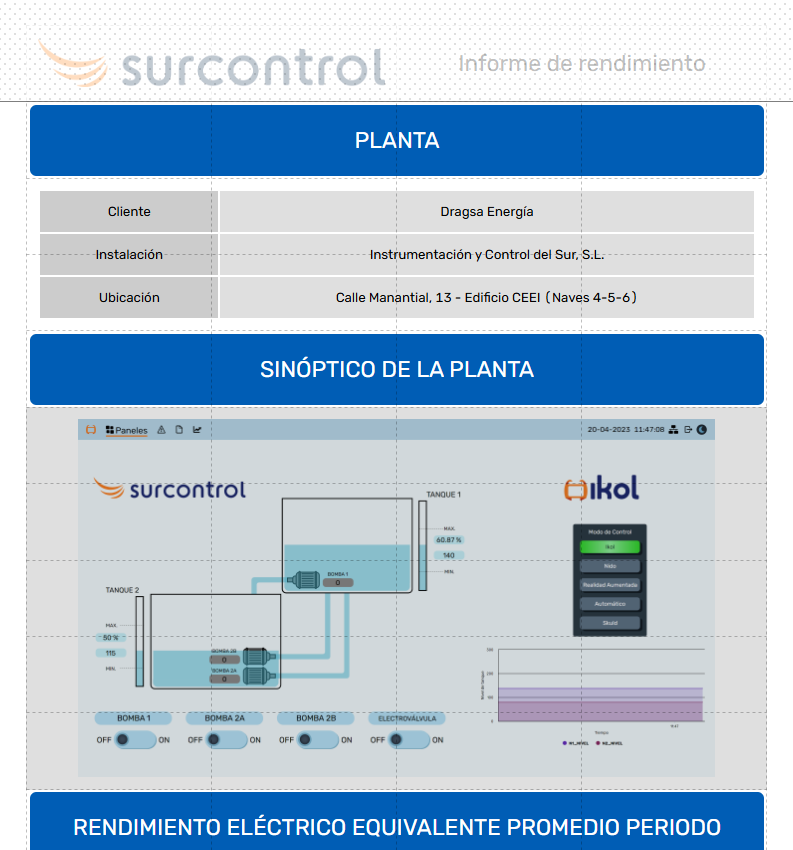
La plataforma permite personalizar los colores, ejes y estilos de gráficos y paneles, lo cual ayuda a mantener la coherencia visual con la identidad de la empresa y mejorar la experiencia de usuario.Generación eficiente de informes
Con Dragsa, es fácil diseñar plantillas de informes con elementos personalizados, agilizando la producción de reportes y asegurando que cada informe esté alineado con los objetivos del cliente o del proyecto.
Personalización sin limites